What Is Plastic Injection Molding and How Does It Work?

Plastic injection molding turns small plastic pellets into precise parts through heat, pressure, and a shaped metal tool. The process appears straightforward. In practice, each stage matters. Resin is dried when needed, heated until it flows, then pushed into a closed mold. After cooling, the mold opens and ejects the finished component.

This method is common in products such as appliance housings, bottle caps, medical device components, and automotive clips. Its appeal is repeatability: one well-designed mold can produce many similar parts with little variation. But consistency is not automatic. Material choice, wall thickness, gate location, temperature, and cooling time all influence the result. A part may warp, show sink marks, or trap air if the design or settings are poorly matched. Small flaws can become expensive at production scale.

Understanding plastic injection molding means looking beyond the machine cycle. The mold itself can require substantial design work and investment, so the process is often best suited to medium or high production volumes. That rule has exceptions. The right choice depends on part geometry, material, expected quantity, and quality requirements. No single setting works for every resin. Engineers use simulation, prototypes, and measured production data to refine the process, though real results can differ from early estimates. This guide explains how the method works, what happens at each stage, and which trade-offs deserve attention before a project begins. Some decisions remain imperfect. They should be examined, not hidden.
What Is Plastic Injection Molding and How Does It Work?

Machine and Mold Anatomy: Injection Unit, Clamping Unit, and Mold

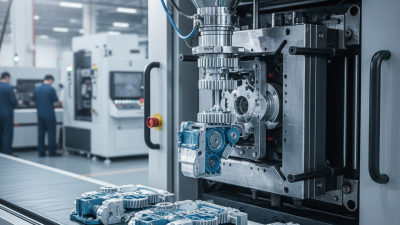
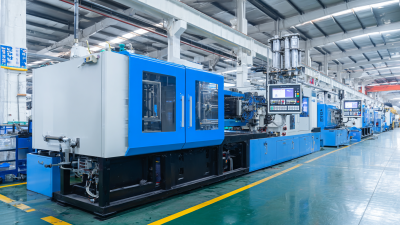
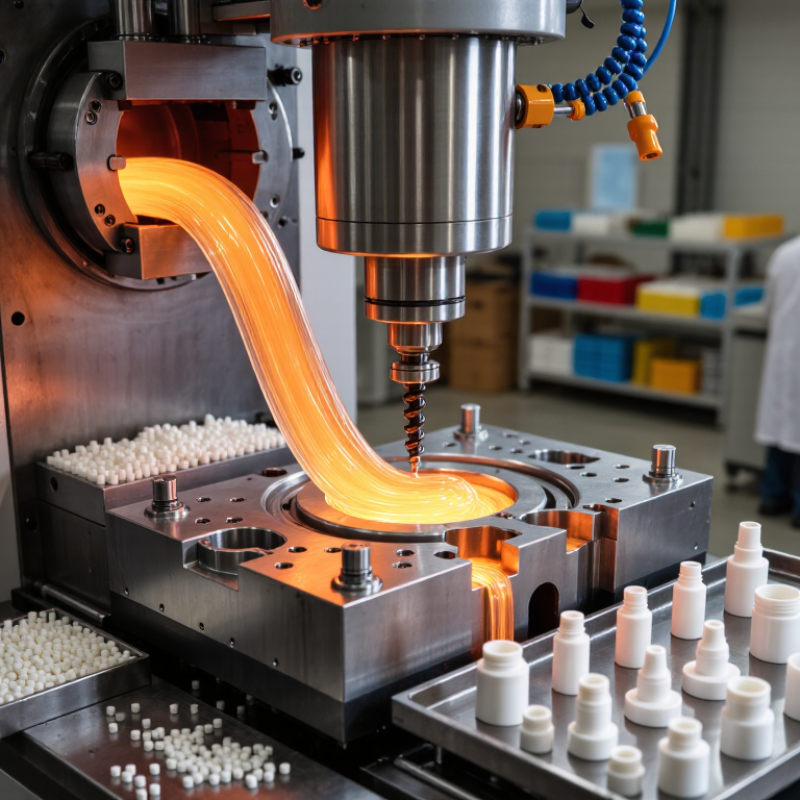
An injection molding machine has three main parts: the injection unit, the clamping unit, and the mold. The injection unit feeds plastic pellets into a heated barrel. A rotating screw melts and moves the material forward, then pushes it through a nozzle. The melt enters the mold through a sprue, runners, and small gates.

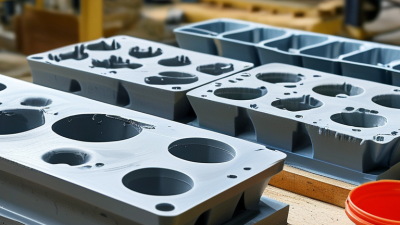
The clamping unit holds the mold halves together under pressure while plastic fills the cavity. Once the material cools, the clamp opens and ejector pins release the part. Inside the mold, the core and cavity shape the product; cooling channels help control solidification.

These details matter. A gate that is too small, for example, can restrict flow and leave a short shot. It is easy to focus on machine settings and overlook the mold’s role. I have to remind myself that the process is a system, not one adjustable dial.

Tips: Check for consistent part weight, clean gate marks, and complete filling. If defects appear, inspect material, mold temperature, and clamping before changing several settings at once. Small changes are easier to evaluate. A setup can still need refinement.

Resin Preparation: Drying to Grade-Specific Moisture Limits

Before plastic pellets enter the injection molding machine, their moisture content may need careful control. The correct limit depends on the resin grade, not just its polymer family. Some materials absorb moisture from room air; others need less intensive drying. Check the grade’s technical data for its specified moisture target, drying temperature, and drying time.

Moisture can turn into steam or cause polymer chains to break down during melting. The result may include bubbles, silver streaks, weak parts, or inconsistent surface finish. A clear pellet is not necessarily a dry pellet. Use a suitable moisture analyzer when the process requires a precise reading, and keep dried resin in a clean, sealed hopper or container. Warm, humid air can undo the work.

Drying conditions matter. Excessive heat or time may damage resin, while insufficient drying leaves moisture behind. Confirm that the dryer reaches its set temperature and maintains appropriate airflow; record the actual drying conditions during production. A practical detail is easy to miss: opening a container repeatedly exposes pellets to room air. Even with good equipment, a reading from one sample may not represent the entire batch, so sampling and handling deserve attention.

Plasticizing and Filling: Typical Injection Pressures of 70–140 MPa

Plasticizing and filling involve different actions. During plasticizing, the rotating screw melts and mixes pellets; screw speed and back pressure influence melt quality. During filling, the screw moves forward and pushes the melt through the nozzle, runner, and gate. Industry processing guidance commonly places injection pressure around 70–140 MPa, or roughly 10,000–20,300 psi. The Injection Molding Handbook by Osswald, Turng, and Gramann discusses the equipment and process variables behind these pressure demands. The range is a guide, not a recipe.

Pressure must overcome resistance as melt travels into the cavity. Thin walls, long flow paths, small gates, or a melt that cools too quickly can raise the required pressure. A practical detail: the pressure shown on a machine may not equal pressure at the cavity, because losses occur along the flow path. Cavity-pressure sensors provide a more direct view. Too little pressure can leave short shots or weak weld lines; too much may cause flash or stress. I would not treat a single number as proof of a good setup. The same mold can need different settings after a material lot or temperature change. That deserves a second check.

Packing, Cooling, and Ejection: Common Cycle Times of 10–30 Seconds

A plastic injection molding cycle often takes 10–30 seconds for a small or medium-sized part, but that range is only a starting point. Once molten plastic fills the mold, packing pressure pushes extra material into the cavity as the plastic begins to shrink. This helps prevent sink marks near thick ribs or screw bosses. Too much pressure can create flash or internal stress. The balance is easy to describe, harder to tune.

Cooling usually takes the largest share of the cycle. The part must become rigid enough to hold its shape after ejection, and thicker sections need more time than thin walls. A warm part may warp on the conveyor or show a slight twist minutes later. Mold temperature, resin type, wall thickness, and cooling-channel layout all affect the result. A quoted 15-second cycle may not suit a part with a chunky corner.

Ejection starts when the mold opens and pins push the part free. The pins need enough force to release it without leaving deep marks or bending a soft feature. This is where estimates get messy: operators may shorten cooling by a second, then see inconsistent parts across a full run. Small trials and measurements matter more than a neat number on a process sheet. Some cycles really are longer.

Part Inspection: ASTM D955 Shrinkage Testing and ISO 20457:2018 Tolerances

Plastic parts can look stable at ejection, then change as they cool and condition. ASTM D955 provides a method for measuring molding shrinkage on specified test specimens. Measurements compare specimen dimensions with mold dimensions, helping engineers observe shrinkage along and across the flow direction. Keep the material, mold temperature, packing settings, and conditioning period documented. Otherwise, two measurements may tell different stories.

ISO 20457:2018 addresses tolerances and acceptance conditions for molded plastic parts. It helps teams set realistic dimensional limits, but it does not make every feature equally predictable. A thick boss beside a thin wall may cool unevenly. A hole can shift slightly as the part releases. Drawings should identify critical dimensions and their tolerances, rather than rely on a general assumption that every feature will hold the same accuracy.

Use both references with the part’s function in mind. Measure parts after a consistent conditioning period, using suitable instruments and repeatable datums. Record results from multiple cavities and production cycles; one carefully measured part is not enough. Reality is messier. Shrinkage testing can reveal a pattern, but it cannot perfectly predict every production variation. When results approach a tolerance limit, review the process and the measurement method before changing the mold.

What Is Plastic Injection Molding and How Does It Work? — Part Inspection: ASTM D955 Shrinkage Testing and ISO 20457:2018 Tolerances

Data note: Shrinkage readings and part-inspection results below are illustrative engineering examples, not certified test results or acceptance limits specified by ASTM D955 or ISO 20457:2018. Actual results depend on material grade, molding conditions, part geometry, measurement method, and the requirements agreed for the drawing.

Inspection area Characteristic Reference or calculation Illustrative data Interpretation
ASTM D955 — Illustrative Mold-Shrinkage Measurements
Test basis Linear mold shrinkage (Mold dimension − molded specimen dimension) ÷ mold dimension × 100% Reference mold dimension: 100.00 mm Compare corresponding mold and specimen dimensions. Record specimen direction and measurement timing with the test results.
Unfilled polypropylene Flow direction 100.00 mm mold dimension 98.40 mm specimen; 1.60% shrinkage Illustrative result; shrinkage varies with resin formulation and processing conditions.
Unfilled polypropylene Transverse direction 100.00 mm mold dimension 97.90 mm specimen; 2.10% shrinkage Directional differences can occur; assess the directions relevant to the part.
ABS Flow direction 100.00 mm mold dimension 99.50 mm specimen; 0.50% shrinkage Illustrative result only; do not use as a material specification.
ABS Transverse direction 100.00 mm mold dimension 99.30 mm specimen; 0.70% shrinkage Use measured, grade-specific data when designing the mold.
Unfilled PA6 Flow direction 100.00 mm mold dimension 98.90 mm specimen; 1.10% shrinkage Moisture conditioning and test conditions can affect dimensional measurements.
Unfilled PA6 Transverse direction 100.00 mm mold dimension 98.60 mm specimen; 1.40% shrinkage Document conditioning and measurement conditions when comparing results.
PA6 with 30% glass-fiber reinforcement Flow direction 100.00 mm mold dimension 99.60 mm specimen; 0.40% shrinkage Reinforcement can reduce shrinkage and increase directional variation.
PA6 with 30% glass-fiber reinforcement Transverse direction 100.00 mm mold dimension 99.30 mm specimen; 0.70% shrinkage Illustrative result; fiber orientation and geometry influence actual values.
ISO 20457:2018 — Illustrative Molded-Part Tolerance Checks
External length Linear dimension Nominal 50.00 mm; illustrative drawing tolerance ±0.20 mm Measured 49.92 mm; allowable range 49.80–50.20 mm Passes the stated illustrative drawing tolerance.
Hole diameter Linear dimension Nominal 10.00 mm; illustrative drawing tolerance ±0.10 mm Measured 10.12 mm; allowable range 9.90–10.10 mm Does not pass the stated illustrative drawing tolerance.
Flatness Geometric characteristic Illustrative drawing limit: 0.25 mm maximum Measured deviation: 0.18 mm Passes the stated illustrative drawing limit.
Inspection planning Tolerance selection Apply the applicable ISO 20457:2018 provisions and the agreed part drawing. Consider material, nominal size, feature type, process capability, and measurement method. ISO tolerance requirements are not represented by the example drawing limits above. Confirm the applicable tolerance specification for the part and feature.